Journey to the Center of the Earth
December 17, 2007

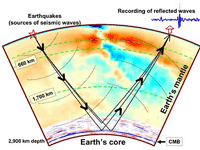
Figure 1. In seismic tomography, seismic waves from an earthquake near the surface (red star) propagate downward and bounce off reflecting layers near the core�mantle boundary (CMB). The rays converge again at a distant seismometer (red arrow). Traces from many thousands of recordings enabled van der Hilst and de Hoop to reconstruct the layers shown in this picture, which are based on real data. Figure courtesy of Rob van der Hilst, MIT.
Dana Mackenzie
Even as far-roving spacecraft have made pictures of other planets almost routine, one world remains frustratingly hidden to us---the inside of our own planet. This year, however, Earth's interior got a little bit more transparent. Using techniques from micro-local analysis and statistics, Rob van der Hilst, a geophysicist at MIT, and Maarten Van de Hoop, an applied mathematician at Purdue University, have produced stunning new images of one of the least-understood parts of Earth---the region where the molten outer core interfaces with the solid lower mantle.
"These are the first high-resolution images of the core�mantle boundary region," de Hoop says. The images show a complicated geometry of reflecting layers near the core�mantle boundary (Figure 1). The two researchers believe that these reflections mark a newly discovered phase transition from a mineral called perovskite to postperovskite. Although the interpretation will probably remain controversial for a while, van der Hilst emphasizes that the layers themselves are real. "That's why the most important part of this is the imaging," he says. "That I believe won't change.
"
At 2900 kilometers, the core�mantle boundary is much deeper than the structures normally imaged via reflection seismology. (See How Geologists See Underground; http://www.siam.org/news/news.php?id=1253.) Oil and gas prospectors have used the reflections of seismic waves for years to detect structures in Earth's crust. Their method is an extension of the Radon transform, the mathematical technique used in such medical imaging devices as CAT scanners. On land, exploration seismologists use dynamite or large vibrators to create a seismic wave; in the ocean, they use airguns. They have considerable control over the direction of the waves, with potentially a two-dimensional array of sources and a two-dimensional array of receivers. They can thus produce extremely detailed, almost photographically accurate underground images.
Unfortunately, it takes a much bigger jolt to send a seismic wave to Earth's core and back---a jolt that only an earthquake can provide. For this reason, the available data is sparser and the source location of such waves is impossible to control. In addition, the mathematical techniques required to "invert" the seismic data to produce an image are much more intricate.
Van der Hilst expects many spin-offs to emerge from the capability to see into the deep Earth. For example, assuming that the layers do come from a mineralogical phase transition, this information can be used to take the temperature of the lower mantle. This in turn could have important repercussions for understanding our planet's history.
The mathematical voyage to the center of the Earth began at a coffee shop in Cambridge, Massachusetts. De Hoop and van der Hilst had known each other since their university days in Utrecht, but they didn't seriously consider working together until 2001, when they got together for coffee at Au Bon Pain. There, de Hoop sketched out some ideas he had for taking reflection seismology to places it had never gone before.
Mathematically, de Hoop's proposal had two pieces: microlocal analysis and statistics. The former is a mathematical theory that extends the methods invented by exploration seismologists for inverting seismic traces, as described in the sidebar. Earth's interior can be described by five dimensions of data, rather than three. That is, at every point in the interior (three dimensions), the rock will have a different reflectivity, which depends on the angle between the incoming wave and its reflection (a fourth dimension) and also on the azimuth, or compass direction, of the plane in which the incoming wave and its reflection lie (the fifth dimension). Conveniently, the seismic data also has five degrees of freedom: the latitude and longitude of the source (two degrees of freedom) and the receiver (two more), and the time it takes the wave to travel from source to receiver (one degree). In principle, then, the data should suffice to determine the physical properties of the rock. But it's not so easy: Because there can be multiple paths from source to receiver, as illustrated in the sidebar, the transformation from data space to physical space is not one-to-one. Microlocal analysis helps disentangle these complications.
The second ingredient de Hoop proposed is a statistical technique that produces not only an image of a reflecting layer of rock, but also a confidence interval that tells how likely it is that a reflector is really there. This is a necessity when a very faint signal is to be reconstructed from lots of noisy data. A key point about the technique is that the seismologist does not have to know in advance that there is a reflecting layer at all. The decision-making can be left to the data.
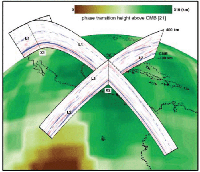
"Not only do you let the data decide, but you use an enormously large number of seismograms that individually wouldn't convince you that you're seeing anything," says de Hoop. "We used weaker earthquakes of lower quality" than most seismologists would. In fact, van der Hilst gathered a database for about 2000 earthquakes, each recorded at around 1300 different seismic stations. (Essentially, these were all the earthquakes of magnitude greater than 5.5 and less than 6.7, in the general vicinity of the Cocos Plate of South and Central America; see Figure 2.) From this collection of more than 1 million seismic recordings, they winnowed the database to about 80,000, which they used for further statistical study. Even so, the database contained many recordings that many seismologists would have discarded as junk. "They've thrown in the kitchen sink," says Thorne Lay, a seismologist at the University of California at Santa Cruz. "I would have used about 5000 of these traces myself."

Figure 2. Geographic location of van der Hilst and de Hoop's images of the core�mantle boundary. The cross sections intersect over Central America. Horizontal streaks mark the locations of reflecting layers. The core�mantle boundary is at the bottom of the transects. Layer L1 is the location of a putative transition between perovskite and postperovskite mineral phases. From "Seismostratigraphy and Thermal Structure of Earth's Core�Mantle Boundary Region," R.D. van der Hilst, et al., Science, March 30, 2007, 315:1813; reprinted with permission from AAAS.
Van der Hilst and de Hoop were betting that the junk contained some information, which could be extracted, in part, by Bayesian statistics. "Even if you cannot see the signal, if you have enough data---tens of thousands or hundreds of thousands of records---the combined dataset is large enough that you can start to get information out," van der Hilst says.
The proof of their concept appeared this year in the March 30 issue of Science magazine. The collaborators' first-ever "data-driven images" of the core�mantle boundary (CMB), 2900 kilometers beneath Earth's surface, show that a lot goes on in the mantle, which was once thought to be a relatively homogeneous layer of rock.
The images show, in particular, that seismic waves speed up abruptly about 300 kilometers above the CMB, and then slow down again less than 100 kilometers above it. This behavior has been seen before in localized studies (including one by Lay), but this is the first evidence that it occurs over a swath of Earth the size of a continental plate. Van der Hilst and de Hoop believe that the waves' behavior could come from a "postperovskite lens." The upper boundary of the lens would form where the pressure gets high enough to compress perovskite into a more compact form. But when the temperature gets too high, very close to the CMB, the postperovskite becomes unstable again and changes back to perovskite. That would be the lower boundary of the lens. The lens can form only if the core is sufficiently hot; otherwise, one would see postperovskite all the way down to the core�mantle boundary.
Using this reasoning, the two researchers---joined at this point by four other collaborators, from MIT, the University of Illinois, and the Colorado School of Mines---estimated the temperature of the CMB at 3950 degrees Kelvin, plus or minus 200 degrees. Previously published estimates, based on the melting point of iron, range from 3200 to 4800 degrees Kelvin. Geophysicists would love to have a precise answer: It would tell them how fast the core is cooling, how much of Earth's heat is generated in the core, and, therefore, how much of the convection in the mantle (which drives plate tectonics) is due to heating from below. The hotter Earth's core is, the more likely it is to cause upwellings of hot material through the mantle. Such upwellings are a deep mystery to geologists. They are associated with "hot spots" like the one that formed the Hawaiian islands. A controversial theory says that super-sized volcanic eruptions, resulting from massive upwellings, may have caused several mass extinctions. "There are many first-order questions we don't know about upwellings," van der Hilst says. "How many are there, what is their shape, and where do they come from---the CMB or somewhere else? Can they stop [before reaching the surface]?"
Van der Hilst and de Hoop also noticed many layers of reflectors below the region where the Cocos lithospheric plate dives under the South American plate. They interpreted this as buckling of the plate as it sinks down into the mantle. What surprised them was the extension of the buckling all the way down to the core�mantle boundary. "We did not expect that much complexity in our image," de Hoop says. They conclude that the lithospheric plate remains more or less intact as it sinks to the bottom of the mantle. "There is still ongoing research about convection in the mantle, and whether there are two convection layers or one," says de Hoop. Their image would suggest that the answer is just one, at least under South America. "In another part of the world, it probably would be different," de Hoop cautions.
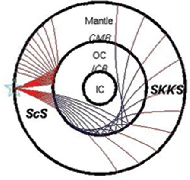
According to van der Hilst, their project is just beginning to take off. The two are currently busy analyzing a different set of seismic waves, which refract through the CMB into the outer core, bounce back out to the CMB, and refract out again to the surface---forming a bent "V" shape. Because these "SKKS waves" emerge over a much broader part of Earth's surface (see Figure 3), this technique will allow them to use more seismic data. They will also be able to study the boundary layer from more different directions. "It would be like standing in the core and looking up, and asking what does it look like. Again, that has never been done before," says van der Hilst. "That is complete terra incognita."

Figure 3. In their most recent work, de Hoop and van der Hilst are analyzing seismic waves that start from an earthquake near the surface (indicated by star). "SKKS waves" refract at the core�mantle boundary (CMB), continue passing through the outer core (OC), bounce off the CMB and back into the outer core, and finally pass through the CMB again. Notice that these waves can be detected around the globe at locations far more numerous than those for the simpler "ScS waves" (left) analyzed by de Hoop and van der Hilst in their Science paper. Illustration from Rob van der Hilst and Maarten Van de Hoop.
For de Hoop, learning the ins and outs of geophysics has been a challenge, but one that he considers easier than trying to persuade geologists to learn mathematics. "When you come from the world of microlocal analysis, it's hard to convince the earth scientists that they need to learn your things. So I followed the reciprocal path," he says. But de Hoop stresses that the benefits of the interdisciplinary collaboration have not been only one-way. "Gaining insights into the geodynamics and mineral physics also inspires new developments in the mathematics," he says. "It is not merely an application of known mathematics."
Dana Mackenzie writes from Santa Cruz, California.

