Pattern Recognition and Gene Expression
May 3, 2002

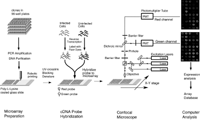
Figure 1. Complementary DNA microarray technology.
Edward Dougherty
In an invited talk on Wednesday, March 6---the day shared by the back-to-back SIAM conferences on imaging and life sciences---I discussed mathematical links between the emerging discipline of genomic signal processing and image/signal processing. Among the issues covered were the classification of disease at the genetic level, nonlinear multivariate control within the genome, and modeling of the genomic regulatory network. The title of the talk---"Mathematical Morphology and Genomic Regulation"---was chosen to reflect the representational power of the former within imaging science and the central role of the latter within cellular function (and malfunction, as in cancer). In the short note that follows, the focus is on pattern-recognition issues and the use of gene-expression data.
A cell relies on its protein components for many of its functions, including the production of energy, biosynthesis of component macromolecules, maintenance of cellular architecture, and the ability to respond to intra- and extra-cellular stimuli. Each cell in an organism contains the information necessary to produce the entire repertoire of proteins for that organism. Control of protein production via the amounts of the nucleic acid mRNA expressed by individual genes is a primary means for regulating cellular activity.
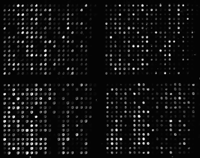
Using complementary DNA microarray technology, we can determine the relative abundance of mRNA in distinct tissue samples. The technology combines robotic spotting of small amounts of individual, pure nucleic acid species on a glass surface, hybridization of multiple fluorescently labeled nucleic acid probes to the array, and detection and quantitation of the resulting fluor-tagged hybrids with a scanning confocal microscope (see Figures 1 and 2). The result is a vector of expression levels, one for each gene on the microarray. In practice, distinct mRNA samples are labeled with different fluors and then co-hybridized onto each arrayed gene.

Figure 2. The power of gene-expression data to separate tissue types has been demonstrated with various cancers.
Achieving these goals requires a classifier that takes a vector of gene-expression levels as input and outputs a class label. The classification can be between different kinds of cancer, different stages of tumor development, or other such characteristics. Design, performance evaluation, and application of classifiers must take into account randomness arising from both biological and experimental variability. To move efficiently from expression data to diagnostics that can be integrated into current pathology practice, or to useful therapeutics, expression patterns must carry sufficient information to separate sample types. Moreover, sufficient information must be vested in sets of genes small enough to serve either as convenient diagnostic panels or as candidates for the very expensive and time-consuming analysis required to determine their use as targets for therapy.
The problem is that a very large set of gene-expression profiles (features) is typically accompanied by a small number of microarrays (sample points), making it difficult to find the best features for constructing a classifier. In addition, given a feature set, two issues must be addressed: (1) design of a close-to-optimal classifier from the sample data and (2) estimation of the error of the classifier. Because a key issue is whether a particular feature set provides good classification, a main concern is the precision with which the error of the designed classifier estimates the error of the optimal classifier. If the amounts of data for both design and error estimation are unlimited, various methods are available for estimating the optimal error within any desired precision; the problem becomes much more difficult, however, with very limited data. In this case, an error estimator might be unbiased but have a large variance, and therefore produce many low estimates. The result can be a large number of variable sets and classifiers with low error estimates. A small sample might yield thousands of variable sets for which the error estimate from the data at hand is zero.
Subtle mathematical questions arise with all of these issues. It behooves us to draw on the extensive theory of pattern recognition developed over the last forty years and to further develop that theory for the general problem of small-sample estimation. Especially important will be further exploration of conditions for the beneficial application of classifier constraints and the integration of biological knowledge in classifier formation.
Edward Dougherty is a professor of electrical engineering at Texas A&M University and an adjunct professor in the Department of Pathology at the University of Texas M.D. Anderson Cancer Center.

