Researchers Look to Statistics in Quest to Quantify Uncertainty
January 14, 2000
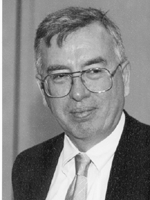
Fred Howes, whose sudden death in December has deprived the applied and computational mathematics community of a good friend and superbly effective colleague, has been awarded a posthumous commendation by SIAM. The award recognizes "his exemplary service and leadership in the development of basic research programs in applied and computational mathematics." During his eight years as program manager for applied mathematics at the Department of Energy, according to the commendation, Fred "played a vital role in setting research directions in applied mathematics and computational science." As one recent example, his support for innovative programs in predictability made DOE a leader in this area. In computational science, his support for educational programs "helped to establish this important area of research."
Barry A. Cipra
Computers have a knack for exactness. Two plus two is four, no more, no less. Machines don't see any need to second-guess themselves. But could their penchant for precision and certainty be a recipe for disaster?
That's a distinct possibility, according to some scientists. An increasing cadre of researchers say that computer models of complex phenomena are in dire need of some introspective self-doubt. When simulations lack error bars or other expressions of uncertainty, the snazzy graphics and multi-decimal-digit numbers that pour out of a computer can give a dangerously misleading impression of accuracy. And if left to their own devices, computers could wind up making unwise decisions with nasty consequences for humans.
The movement to expose---and eradicate---computer modeling's dirty little secret has been building for several years (see SIAM News, December 1998). A recent meeting in Santa Fe, sponsored by the Committee on Applied and Theoretical Statistics (CATS) of the National Research Council, Los Alamos National Laboratory, and the National Institute of Statistical Sciences, in Research Triangle Park, North Carolina, focused on the use of statistical approaches for the evaluation of complex computer models. A related meeting on predictability of complex phenomena, sponsored by the Department of Energy and held at LANL, also highlighted the growing role for statisticians.
The latter meeting was overshadowed by the sad word that Fred Howes, program manager for the mathematical, information, and computational sciences at DOE and a leader in the effort to make predictability an important research emphasis, had died suddenly two days earlier.
The Fallacy of Physics
Modelers have traditionally eschewed statistics, preferring instead to put more "physics" into their simulations. In many cases, the inclusion of physics is taken literally. Atmospheric modelers, for example, have sought to make their calculations more accurate by incorporating the radiative properties of clouds and vegetation. In other cases, physics is interpreted as anything that makes the model more complex---replacing the proverbial spherical cow with an ellipsoid, say.
Traditional modeling also emphasizes resolution. Grid refinement is the obvious way to absorb an increase in computational power. (If computers keep doubling in size and speed every 18 months, then CFD calculations for a cubic centimeter of fluid, which currently strain to run a thousand grid points in each direction, could reach the atomic level by the end of the 21st century. Atmospheric CFD would take a little longer.) Technical questions of convergence have dominated the discussion.
These are all important issues. But how relevant are they for models plagued by inherently incomplete and uncertain data, not to mention phenomena with built-in random fluctuations? Speakers at the Santa Fe and Los Alamos workshops pondered the question for a range of applications.
Take traffic, for example. Nagui Rouphail, a civil engineer at North Carolina State University, and Jerry Sacks, director of the National Institute of Statistical Sciences, described a project in which a program called CORSIM (Corridor Simulator) is being used to analyze the timing of traffic signals in a portion of Chicago, between O'Hare Airport and the downtown Loop. CORSIM, which was developed by the Federal Highway Administration, features an animated bird's-eye view of traffic: Rectangular cars and buses crawl along, change lanes, and queue up at stop lights. The model includes realistic features, such as cars entering an intersection after the light has turned red. It also includes obvious simplifications, such as "drivers" who decide at random whether to turn or go straight. (The probabilities are tunable parameters of the model. The simplification means that vehicles have no memory of where they've been, nor any particular destination.)
Rouphail and Sacks found that an "optimal" signal timing pattern in their simulations reduced the mean queue time in an hour's worth of afternoon rush-hour traffic from 283 vehicle-minutes to about 224. But the means came with standard deviations of 76 and 91, respectively. Curiously, in trying to pinpoint the source of the large deviations, the researchers determined one hangup to be an intersection in which the simulated cars, as specified by the program, were actually stopping at a stop sign. The backups that were occurring sometimes extended to other intersections, causing a ripple of slowdowns. When they changed the rules and allowed for "rolling stops," the simulations ran more smoothly. (But don't expect that explanation to succeed with a traffic cop.)
Traffic models are inherently probabilistic, and that makes data gathering problematic. The Chicago project had teams of car counters (mostly students) stationed at intersections, keeping track of vehicles arriving, turning, and queueing up at red lights. The range of maximum queue lengths produced in 100 runs of CORSIM fit well with observations-in part because of the simulations' large variance. As Sacks points out, "the human error in this data is enormous." The observations of two car counters at the same intersection sometimes differed by as much as 20%.
The situation in atmospheric modeling is not much better. Robert Fovell, an atmospheric scientist at the University of California at Los Angeles, and UCLA statistician Richard Berk outlined some of the problems that arise with precipitation models. Rain gauges, without producing the mistakes of human car counters, still give only a rough indication of precipitation patterns, primarily because they're so widely spaced. In the LA Basin, for example, most of the rain falls on mountain slopes, but that's not where the gauges are located. When it comes to run-off, which is what hydrologists worry about, it's important to know which side of a mountain the rain falls on, along with the amount of rain that falls-two details the models have a tough time getting right. In short, Fovell admits, "we're trying to fit bad data to a bad model."
Feel the Burn
Wildfires are even harder to compute. Rod Linn, of the atmospheric and climate sciences group at LANL, described some of the limitations of wildfire models. Wildfires depend on a huge number of physical processes, ranging from the chemical reactions that take place when fuel beds burn to large-scale atmospheric effects induced by terrain. Each aspect alone, while complicated, is manageable. But computing them all at once gets dicey. "The more small-scale physics you include, the greater the probability of corrupting things with something bad," Linn warns.
The models produce realistic-looking animations, with color-coded temperature profiles of advancing flames and curling plumes of smoke (examples from LANL's Wildfire Project can be seen at ees5-www.lanl.gov/EES8/wildfire.html). But the details are difficult to validate, Linn says. Wind-tunnel experiments are of limited value, and field experiments with controlled burns are constrained by the defining fact of being controlled. One of the few easily measured aspects of an actual wildfire is the rate at which it spreads. Data for things like heat flux and fuel depletion-the main properties calculated by the models-are virtually impossible to obtain.
Data collection is also difficult for models of human disease, observes Alan Perelson, a mathematical biologist at LANL. It would be nice to know exactly how the body disposes of foreign pathogens, but progress is stymied by human intransigence, he explains: "People don't like to be cut up." It's tough enough getting blood samples.
Perelson presented some recent work in modeling of the immune system, a field he describes as "very undeveloped." In particular, no comforting analog to the Navier-Stokes equations gives researchers the illusion that they've got a handle on the first principles. To put it simply, Perelson says, "we don't know how the system works."
Instead, "toy" models predominate. In one such model, antibodies and antigens (the "good" and "bad" guys, respectively, in the world of immunology) are reduced to simplistic 20-symbol strings from a four-symbol alphabet; their complicated biochemical interactions boil down to a simple string-matching process, with 13 as the unlucky number: If the antibody and antigen agree in 13 symbols (or fewer), the antibody fails to "recognize" the antigen and thus does not attack it. The results of such models must be interpreted carefully.
Therein lies the problem for computer models in general. No one's saying the models are worthless. (More precisely, no group is saying that its model is worthless.) On the contrary, everyone agrees that computer simulations are essential for solving the complex problems of modern techno-society. Perelson and colleagues, for example, have used their simple model of the immune system to clarify a debate about the effectiveness of repeated annual flu shots. Previous field studies had led to conflicting conclusions. In a recent paper in the Proceedings of the National Academy of Sciences (November 23, 1999), the modelers report that the simple counting criterion can account for the observation that repeat vaccinations are sometimes effective in warding off a new strain of flu and sometimes not.
Statistics to the Rescue
As long as models are in the hands of experts, who know the extent to which their simulations rely on approximations and simplifications, no one's fooled by the illusion of accuracy. But when models escape the confines of the cognoscenti, all bets are off. And if the ultimate goal is to take humans out of the loop altogether and let computers run things unsupervised, the need for quantifying uncertainties in the models becomes imperative.
Statistical approaches can help in several ways, workshop participants stress. Comparing the output of models with observed data is "just a piece of it," says Sallie Keller-McNulty, a statistician at LANL. Modelers can also look to statistics for help with experimental design and parameter estimation. Another role for statisticians is in building stochastic components or submodels to replace slow-running deterministic computations. And the crucial task of analyzing the uncertainties that propagate through complex models is fertile ground for statistical thinking.
"We need to be playing a bigger, more important role in working with the modelers," Keller-McNulty concludes. "There's a lot to be gained on both sides."
Several "success stories" were highlighted at the two workshops. Gregory Eyink of the University of Arizona described an example from climatology: a "toy" model sporting the bimodal possibilities of "present climate" and "ice age." Tracking transitions between two stable states is tricky business for standard methods, he says. But new variational methods, first developed in turbulence theory, do much better. Similarly, Doug Nychka of the Geophysical Statistic Project at the National Center for Atmospheric Research presented encouraging results from statistical analyses of a regional ozone model.
George Karniadakis of Brown University reviewed the status of direct and large-eddy simulations of turbulent flows, emphasizing the role of complex geometries. (When it comes to turbulence, it doesn't take much to make the geometry complex: A cylinder placed at right angles to a flow is enough to keep any computer busy calculating downstream eddies.) Anton Kast of Lawrence Berkeley National Laboratory presented some new methods in optimal prediction for many-body mechanics, such as molecular dynamics, which yield accurate average solutions even though they use relatively large time steps.
Several speakers talked about general methods for evaluating uncertainty in computer models. Gregory McCrae, a chemical engineer at MIT, emphasized the need for dealing up front with uncertainties. "We need to think about uncertainty before we build the models," he says. This means, among other things, working with probability distribution functions. Max Morris, a statistician at Iowa State University, described a statistical approach to sensitivity analysis, aimed at determining the relative importance of input variables on output. Michael McKay, a statistician at LANL, elaborated further on the abstract underpinnings of uncertainty analysis and its concrete application to systems with dozens of inputs, such as PDEs.
"In a way what we're trying to do is formalize things everybody already knows," McKay explains. "It's a sign of a maturing field that people can step back from individual problems and ask if there's a general methodology," adds Scott Weidman, director of the NRC's Board on Mathematical Sciences. It may even be the tip of a much larger iceberg, he suggests. "People are starting to think of a metaproblem: How to build a better science of computer science." And with more attention paid to uncertainty, computer models are certain to gain in reliability.
Barry A. Cipra is a mathematician and writer based in Northfield, Minnesota.
![]()